Financial Markets and Corporate Environmental Results
Frank Dixon[1]
Environmental Performance Measurement: The Global Report 2001-2002
Oxford University Press, 2002
Environmental sustainability looms as one of the greatest challenges ever faced by business. Financial impacts on companies are growing as customers, regulators, investors, and other stakeholders continue to press for improvements in corporate environmental performance and movement toward sustainability[2]. This drives increasing demand from the financial community for high-quality analysis of corporate environmental performance. The sophistication of analysis has increased greatly over the past five years; however, limited data availability poses ongoing challenges for capital markets, business, and other interested parties, such as nongovernmental organizations (NGOs).
As environmental conditions continue to decline globally, and calls for action to address the situation increase, the need for performance data at the macro and micro levels grows. As noted in other chapters, the availability of transparent, high-quality data spurs competition and performance improvement. At the macro level, data quality varies greatly by region. At the micro level, corporate environmental performance data are often unavailable, inconsistent, lagged, inaccurate, unverified, and biased. This lack of high-quality data clouds relative corporate environmental performance, reduces the efficiency of markets, and presents a significant barrier to meeting the sustainability challenge.
This chapter discusses the drivers of growing financial community interest in corporate environmental performance, methods of measuring such performance, and future measurement challenges. The EcoValue’21™ model, developed by Innovest Strategic Value Advisors, is presented to illustrate one method of addressing data challenges, and to show how environmental performance ratings can be used to increase investor returns.
Overall, the chapter argues that the financial relevance of corporate environmental performance is increasing, and this will drive expanded incorporation of environmental analysis into investment decisions. Ultimately, ongoing improvements in corporate environmental performance data will be needed to minimize investor risk and maximize financial returns.
I. Financial Community Interest in Corporate Environmental Performance
The corporate sector has a large impact on the environment through waste emissions to land, air, and water resulting from production, use, and disposal of goods and services. This impact contributes to the ongoing decline in global environmental quality. Deteriorating environmental conditions translate into financial pressures on companies through increasing regulations; growing demand from consumers for environmentally responsible products, services, and corporate policies; political pressures; rapidly expanding information transparency, largely through the Internet; growing concern among the general public about the state of the environment; increasing investor awareness of the financial benefits of improving corporate environmental performance; and growing competition among firms to improve their pollution control and natural resource management results. As environmental pressures continue to increase, companies that improve environmental performance more than their peers are likely to achieve superior financial returns and competitive positioning over the mid- to long term. In addition, corporate environmental leaders frequently report achieving enhanced profitability in the short term.
In spite of this growing financial relevance, mainstream investors have not traditionally incorporated environmental analysis into investment decisions. The financial community can thus be segregated into two groups: mainstream investors and those who are socially responsible (that is, basing investments on environmental, social, and financial considerations). Traditionally, mainstream investors (representing about 85 percent of invested assets in the United States) considered environmental issues only to a limited degree. The environment was seen as a potential liability (for example, Superfund sites), risk (for example, catastrophic event), and/or cost item (for example, regulatory compliance). It was not traditionally seen as a source of competitive advantage or investment outperformance. The concept of fiduciary responsibility has limited use of environmental analysis in the investment process. This concept holds that the duty to maximize investor returns precludes consideration of issues that do not seem to be financially relevant to the company, such as the longer-term impacts of pollution on the environment and society.
More recently, mainstream investors, such as Dreyfus and Mellon Capital Management, have been using relative corporate environmental performance to differentiate companies and increase investment return. Several factors drive growing financial community interest in corporate environmental performance. First, most studies of links between environmental and financial performance find positive correlations. Second, a reasonable theory exists for explaining correlations and postulating causation—environmental performance is a strong proxy for management quality. Third, socially responsible investment funds (which include environmentally screened funds) frequently outperform nonscreened funds. Fourth, growing pressure for corporations to assume fuller responsibility for their environmental and social impacts increases investor risk exposure. And, finally, recent regulatory requirements and evolving legal views encourage or mandate increased investor focus on corporate environmental performance.
A. Research Findings
Since 1990, most studies of links between corporate environmental and financial performance found positive correlations[3]. A U.S. Environmental Protection Agency study (2000) found, “A significant body of academic research relates measures of corporate environmental performance to measures of financial performance. The most striking aspect of this research is that most of it shows a moderate positive relationship between the two kinds of performance—regardless of the variables used to represent each kind of performance, the technique used to analyze the relationship, or the date of the study. In fact, the empirical evidence is of sufficient consistency and scale to embolden some to argue that a positive relationship between environmental and financial performance is without doubt.”
A recent review (Cram and Koehler, 2001) of more than 40 studies in this area found, “The 1990’s has seen an expanding series of studies probing at the association between a firm’s environmental and financial performance with the general conclusion that it is statistically significant.” Another study by Bank Sarasin (Butz and Plattner, 1999) concluded, “there is definitely a statistically significant positive correlation between environmental performance and the financial return on equities in sectors where environmental performance is relevant in the public perception.”
Positive correlations are also often found in the broader socially responsible investing category, which analyzes social (for example, labor, supply chain, product safety, international, community development, etc.) and environmental metrics. For instance, Pava and Krausz (1995) examined 21 empirical studies and found that 12 had positive correlations, eight had no statistically significant correlation, and only one had a negative correlation.
The EPA and Cram and Koehler studies point out various gaps and errors in some of the previous research that could produce misleading results. Potential flaws in some of the studies include poor data quality, small sample size, short time frame, inadequate control of nonenvironmental factors influencing financial performance, inappropriate cross-sectoral comparisons, emphasis on backward-looking data, failure to establish causation, vulnerability to greenwashing[4], difficulty in assessing impacts on human health and the environment, and inconsistent definitions of environmental performance. To illustrate the complexity of definition problems, Cram and Koehler note that performance based on emissions will improve if a company divests itself of a polluting facility. But if the company continues to buy materials from the same facility, its overall environmental performance may not actually improve.
The Cram and Koehler paper concludes that study flaws “raise considerable doubt on the findings described in the literature thus far” and that this literature “offers no conclusive guidance on managerial and investor decision-making with respect to firm environmental performance.” However, the implication that positive correlations found in the bulk of previous research may not be valid due to study flaws is probably too aggressive for several reasons. First, most of the alleged flaws have about equal probabilities of producing false negative and positive correlations. In other words, most of the potential flaws do not bias the studies toward finding positive correlations. The fact that positive correlations nevertheless are found consistently indicates that the overall findings are probably valid.
Second, Cram and Koehler argue that, as more sophisticated modeling techniques are employed to overcome earlier flaws, positive correlations are still found. Third, measuring highly complex environmental interactions with frequently poor data sometimes requires simplifying of assumptions and use of sub-optimal data sets. These approaches are open to challenge, but without them, research in this area could hardly be done. Fourth, failure to show causation does not invalidate the findings because investors frequently make investment decisions based on factors, such as earnings, that are known to be correlated with but may not be causally linked, to stock price. (In the strictest sense, it is impossible to prove direct causation between stock price and anything since stock price is a collective market opinion.)
Fifth, the authors imply that investors would use analysis of corporate environmental performance exclusively to choose stocks. Except for eco-enhanced index strategies, this rarely occurs. Environmental analysis typically is used in combination with traditional financial analysis to identify well-managed companies and stock market outperformance potential (discussed below). And, finally, Cram and Koehler do not adequately address the fact that there is a logical and intuitively obvious explanation for the existence of positive correlations—the proxy value for management quality.
More research is needed in this area to test the existence of positive correlations between environmental and financial performance. Cram and Koehler’s implication that the existing research is flawed, and investors cannot rely upon it, is probably overly critical. However, the authors add significant value by pointing out methodological weaknesses and suggesting “future directions for this body of research.”
B. Management Quality and Other Explanatory Factors
Causation is notoriously difficult to prove because so many factors influence financial performance. As a result, studies often focus on explaining correlations rather than attempting to prove causation. Several of the studies using historical data to identify correlations between environmental and financial performance cite management quality as a primary explanation. Future-oriented assessments of corporate environmental performance, such as those done by Innovest, find positive correlations more frequently and attribute the findings largely to management quality. This factor probably has a greater influence on financial performance than any other. Management quality influences all aspects of business performance, largely determining success in key functional areas such as product development, marketing, and production. One could say that most factors enabling firms to outperform peers, such as lower costs or strong patent protection, originate from superior management.
Nearly every financial analyst would agree that management quality is one of the primary determinates of financial performance. However, very few have an objective way of measuring management quality. Assessments are usually subjective, based on opinion. Management quality is difficult to quantify because it involves assessing intangible factors such as the intelligence and business savvy of corporate leaders. Assessing management quality can be done by using proxies—for example, by measuring some aspect of management performance, rather than trying to measure management quality directly. This, in effect, is done by analyzing earnings and other financial measures. However, there are so many other internal and external influences that the pure assessment of management quality is clouded. A clearer assessment can be made by narrowing the focus to one issue. In other words, test how well management performs in one business area, preferably a highly complex area. Success here implies that management will deal effectively with less complex business issues and, therefore, will produce superior returns.
It turns out that the environment is one of the most complex challenges facing management, especially in resource-intensive sectors, where there is a high degree of technical, regulatory and market uncertainty. There are many internal and external stakeholders to deal with, requiring sophisticated communication skills. There are many complex issues to address, such as global warming. And there are many nontraditional, often nonfinancial metrics to track. It is implied that companies dealing well with this high level of complexity have the sophistication to succeed in other parts of the business. The relationship between good environmental management and good general management may explain why companies recognized as environmental leaders frequently earn superior financial and stock market returns.
Another factor explaining correlations between environmental and financial performance is the direct impact improved environmental performance can have on profitability. Specifically, improving environmental performance can lower risk exposure and costs and increase revenues. Improving performance can lower risk exposure in many areas, including damage to corporate image and reputation, loss of market share, vulnerability to increasing regulations, product obsolescence, impairment of property values, and delay or cancellation of mergers and acquisitions. On the upside, reported financial benefits of improved environmental performance include reduced materials, energy, and waste disposal costs; enhanced product quality, market image, and market share; lower regulatory, insurance, and financing costs; enhanced innovation capacity; improved stakeholder relations; and enhanced employee morale and productivity. For example, 3M claims to have saved $810 million between 1975 and 1997 through pollution prevention initiatives (3M, 1998).
Companies improve environmental performance when the perceived benefits of doing so exceed the costs. However, benefits can be intangible, longer-term, and sometimes simply difficult to quantify. As a result, it may be hard to justify financially investments focused on improving environmental performance. Our research suggests that leading companies tend to have greater ability to deal with intangibles, such as future market perceptions or the indirect financial impacts of pollution. At times, these firms will make marginal improvements in environmental performance that may not make sense on a strict internal rate of return basis. They perceive financial benefits that less sophisticated companies may not be able to see. The complexity of environmental decision making further indicates why environmental performance can be used to differentiate management quality and stock market potential.
Some studies suggest that positive correlation may also occur because more profitable companies may be able to spend more on the environment. Across the spectrum of companies, it is likely that all three explanations are valid—proxy value for management quality, direct impacts on profitability, and superior profits driving superior environmental performance. More research is needed to determine the relative importance of each factor in producing positive correlation between environmental and financial performance.
C. Fund Performance
Traditionally, most investment advisors have believed that screening investments for environmental, social, or any other so-called nonfinancial criteria reduced financial returns, even though most studies have shown the opposite. Inappropriate fund comparisons have contributed to the idea that socially responsible investment funds underperform. For example, some studies have inappropriately grouped different types of funds (value, growth, etc.) together and compared them to other fund classes. However, socially responsible investing is a discipline that can be applied to all fund classes; it is not a separate fund class.
Earlier approaches that used negative environmental and social screening exclusively did underperform the market at times[5]. Newer fund strategies using best-in-class approaches that maintain diversity and shift investments toward presumably better managed companies frequently have outperformed nonscreened (mainstream) funds. More recently, both negatively screened and best-in-class (or positively screened) funds often have matched or exceeded the performance of mainstream funds. For example, 14 of the 16 environmentally and socially screened funds with over $100 million in assets received top scores from rating services Morningstar and Lipper Analytical Services in 2000. Overall, 65 percent of the funds with a greater than three-year performance record received top scores (Social Investment Forum, 2001).
The availability of better information on environmentally and socially screened fund performance and findings from the many studies noted above is causing a growing belief in the financial community that environmental and social screening does not lower returns and, in many cases, may enhance them. This partly explains the rapid growth of these funds in North America, Europe, and Japan over the past five years. At the end of 1999, environmentally and socially screened investments represented over $2 trillion in U.S. assets (Social Investment Forum, 1999).
D. The Evolving Role of Corporations in Society
As environmental conditions continue to decline, companies may be called on to take fuller responsibility for their negative environmental impacts and to adopt a systems view of the environment. As firms are held responsible for a wider range of impacts, investor risk exposure likely will increase. Before the industrial revolution, society’s impact on the environment was insignificant in relation to the ability of the environment to absorb the impact. Driven largely by the use of fossil and nuclear energy, human impacts are now significant and may be approaching the point of overwhelming the environment’s ability to regenerate itself. All aspects of Earth and its atmosphere are one interconnected system. No part operates in isolation. Traditionally, the total Earth system was too complex to study as a whole So, through reductionism, the parts were studied in depth. However, the overall system and relationships between its parts was not studied nearly as well. As a result, solutions to problems in one area became problems in another, as in fossil fuel combustion causing global warming.
Economic and commercial systems developed when human impacts on the environment were relatively small did not hold companies fully accountable for the harm they inflicted on the environment. For example, these systems considered clean air and water to be free goods because they were so plentiful. As a result, companies were not charged the full cost of consuming these and other resources. Their focus was only on the efficient production of goods and services.
Now, as the negative environmental impacts of companies have become more obvious, these costs, which have largely been externalized onto society, are being internalized through increasing regulations, customer demands, taxes, and other mechanisms. To an increasing degree, companies are being called on to expand their operating focus to include being a responsible corporate citizen and minimizing their negative environmental and social impacts. Companies failing to move in this direction likely will face growing financial risks and penalties directly from government imposed regulations and indirectly from customers and capital markets.
E. Regulatory and Legal Issues
Growing financial market interest in corporate environmental performance is being driven by regulatory requirements and evolving legal views on the fiduciary responsibilities of fund advisors. For example, the U.K. government implemented legislation in July 2000 that requires pension funds to disclose their methods of screening investments for environmental, social, and ethical factors. As a result, 22 of the 25 largest pension funds in the United Kingdom have adopted such screening methods.
In the legal area, a significant barrier to the use of environmental and social screening has been the belief that directors of pension and other funds have a fiduciary responsibility to maximize returns, which precludes them from considering so-called nonfinancial factors, such as environmental and social performance. This view is changing as studies by organizations such as the law firm of Baker & McKenzie (Gibson, Levitt and Cargo, 2000) find that fiduciaries may consider environmental and social issues when making investment decisions, provided there is reasonable due diligence[6]. Beyond allowing environmental and social screening, other studies find that, in some cases, the duty to monitor (Koppes and Reilly, 1995) and the duty of obligation (Cogan, 2000; McKeown, 1997; Solomon and Coe, 1997) place fiduciaries under a legal requirement to consider environmental and social issues.
II. Measuring Corporate Environmental Performance
How do the capital markets identify superior environmental performance? Corporate environmental performance remains hard to measure, yet, new quantitative analytic tools are being developed. For example, Innovest’s EcoValue’21™ model mitigates data problems and provides a relevant and objective measurement tool for the financial community. This section discusses the current state of corporate environmental performance data, measurement options and complexity, analytic methods, measurement results, and application by the financial community.
A. Data Quality
Standardized public financial reporting has been required in industrialized nations for many years. As a result, it is relatively easy for stakeholders to compare firms on many financial metrics. The requirement for standardized public reporting is not nearly as well developed in the environmental area. While U.S. global leadership has diminished markedly in recent years, the U.S. government remains the world leader in providing publicly available data that permit analysis of corporate environmental performance.
The U.S. Environmental Protection Agency (EPA) provides several publicly available databases[7], including
- Toxic Release Inventory (provides data on releases and transfers of more than 600 toxic chemicals from manufacturing facilities)
- Emergency Response Notification System (ERNS, tracks spills and releases of toxic substances)
- Accidental Release Information Program (updates the ERNS database)
- Water Permit Compliance System (tracks permit violations and penalties assessed under the Clean Water Act)
- RCRA Information System (tracks handlers of hazardous waste under the Resource Conservation and Recovery Act)
- RCRA Biennial Reporting System (tracks the generation and shipment of hazardous waste)
- EPA Legal Action Data (tracks civil cases filed on behalf of the EPA)
- CERCLA Information System (tracks hazardous waste sites under the Superfund Program)
While this information facilitates corporate environmental performance measurement, many improvements still could be made. For example, the TRI tracks emissions from domestic manufacturing facilities; however, because data on the environmental impacts of nonmanufacturing and international operations usually are not available, it makes comparing companies with significant activities in these areas difficult. Also, there is often a long lag time before data are made public. In addition, information is reported at the facility level, and tagging methods often make it difficult to attribute the data correctly to the ultimate parent company. Finally, data often are uploaded by different states and regional EPA offices, making their quality uneven. Through various initiatives, the EPA is attempting to remedy some of these issues.
Some European governments, such as those in the United Kingdom and Sweden, require limited disclosure of corporate environmental performance data. However, varying disclosure requirements in Europe make it difficult to compare companies, especially those with operations in many countries. The European Union is working to standardize disclosure requirements, so it is likely that higher-quality government-supplied data will be available in Europe over the next few years. Beyond government databases, various types of corporate environmental performance data are available from NGOs and watchdog groups.
While government-supplied data are useful, especially in the United States, the most complete source of corporate environmental performance data is usually the companies themselves. Government-supplied data in Europe are sparse compared with the United States. However, European companies generally provide higher-quality data on corporate environmental performance (with many exceptions in North America and Japan). Companies in Europe tend to report more consistent quantified data on environmental impacts. This type of information is more useful to those assessing relative performance than the anecdotal information usually provided by less proactive firms. The quality and quantity of data provided by European firms often more than compensates for the lack of government-supplied data in Europe.
However, corporate self-initiative data not reported under mandatory disclosure schemes remain open to reliability questions. To reduce the perception that company-supplied data are biased, many European firms are seeking third-party certification of their environmental reports. While third-party verification does not eliminate bias potential, since companies still chose which data to report, it is a first step toward providing investors with more reliable data. To improve data quality further, several firms in Europe and North America are beginning to report under standardized environmental and social reporting schemes, such as the Global Reporting Initiative. Expanded use of programs like these has significant potential to facilitate corporate measurement of environmental performance. However, as long as the programs remain voluntary, their usefulness will be limited.
In the United States, accounting rules for contingent liabilities can result in significant underreporting of environmental liabilities. For example, Financial Accounting Standards Board Statement No. 5 states that contingent liabilities, such as environmental remediation liabilities, shall only be accrued if they are probable and can be reasonably estimated. If the estimated cost is within a range, only the minimum cost shall be accrued. Disclosure is only required if a claim has been made, or it is probable one will be made. As a result, financial statements may significantly understate environmental liabilities. This could have a growing negative impact on investors as environmental pressures on companies increase.
A recent study of 13 pulp and paper companies (Repetto and Duncan, 2000) found that each company could expect negative financial impacts from environmental issues of at least 5 percent of total shareholder value (more than 10 percent for some companies), and that these highly probable impacts were not disclosed in financial statements. Several parties, including investment firm Calvert Group, have asked the U.S. Securities and Exchange Commission (SEC) to increase investor protection by expanding current disclosure requirements. The SEC has explored the issue, but has not acted yet. Mandatory disclosure of corporate environmental performance data probably holds the greatest potential for facilitating measurement and prompting competition among firms to improve performance.
B. Measurement Issues and Complexity
Corporate environmental performance assessments can be done in many ways. Options include absolute versus best-in-class ratings, one versus many scores, and historical versus forward-looking analysis. Absolute ratings potentially describe a company’s ultimate environmental impact more accurately and facilitate cross-sector comparisons. However, investors primarily use corporate environmental performance analysis to chose among companies within sectors, so a best-in-class approach is generally most effective. Condensing many metrics into one score provides less information than several separate scores. However, having a bottom-line score helps investors chose among companies, so a single-score approach remains effective. Historical analysis provides a more accurate assessment of a company’s actual environmental impact. However, investors are interested in future performance, so a forward-looking analysis is often more appropriate, although forecasting future results is much more difficult than reporting on past performance.
Beyond numerous assessment options, difficulty in quantifying corporate environmental impacts further complicates performance measurement. As companies are held responsible for a wider range of environmental impacts, minimizing investor risk will require ongoing improvements in corporate impact data. Yet, quantifying corporate impacts is difficult because Earth’s ecosystem is multifaceted and highly complex. The sinks into which companies emit waste (that is, atmosphere, water bodies, land masses) are so large that there are often long feedback loops before impacts can be identified. It is difficult to quantify a firm’s impact on the environment because of these long feedback loops and because impacts can take many forms (for example, human health, ecosystem damage, biodiversity loss, etc.). In addition, it is often difficult to pinpoint a firm’s contribution to a specific impact.
By using proxies and impact indicators, assessing environmental impact can be simplified, assuming the data are made available. To illustrate, many companies, mostly in Europe, are reporting impacts under standard categories, such as global warming, ozone depletion, acidifying emissions, smog-forming emissions, eutrophication, toxic wastes, water use, energy use, and heavy metals. This facilitates cross-company comparisons and helps to minimize investor risk exposure.
C. Analyzing Corporate Environmental Performance
Throughout the industrialized world, a mix of nonprofit and for-profit organizations analyzes corporate environmental performance and provides this information to investors and other stakeholders. For the most part, this analysis involves gathering data through questionnaires, then summarizing anecdotal and quantitative data (when available). Some firms, such as Kinder Lydenberg and Domini, assign ratings in various environmental and social categories, but most organizations are in the business of providing summarized data to investors, who then do the analysis on their own. Fewer firms provide financially oriented analysis of corporate environmental performance data.
The EcoValue’21™ model, developed by Innovest Strategic Value Advisors, uses a multifactored approach to overcome data problems and assess corporate environmental performance more accurately. Using one or only a few data points to assess performance makes the analysis vulnerable to “outliers” and other data weaknesses, potentially providing misleading results, because so many factors influence overall environmental performance. A multifactored analysis minimizes the impact of faulty data since, even if a few data points are inaccurate, companies usually will be placed in nearly the same relative order based on overall averages.
To assess corporate environmental performance, one must first define it; however, with many interpretations available, there is no one “correct” definition. Definitions vary based on the goals of the user. An investor seeking to gauge the financial impact of corporate environmental performance likely would want to assess the financially relevant aspects of a company. These include risk exposure, upside potential (engagement in environmentally related business opportunities), and overall management of upside and downside environmental issues. The EcoValue’21™ model analyzes about 60 metrics grouped into these three categories. While the model was developed for investors focused on financial performance, its comprehensive nature allows it to be used by other stakeholders who are purely interested in environmental performance.
Metrics and weightings for the EcoValue’21™ model were selected using criteria that included the quality of available data (with preference given to quantitative, third-party verified data), business judgment about the relative importance of the metric to overall corporate environmental performance and, most important, correlations with stock returns, since the model was being used to project this. The model was developed with strategic partners, including PriceWaterhouseCoopers and Morgan Stanley. To guide selection of metrics and determination of metric weights, regression analysis was done to analyze correlations between many environmental metrics and stock returns for 350 S&P 500 companies over a five-year period.
In the risk area, the model analyzes such factors as site liabilities, hazardous waste generation, toxic emissions, compliance violations, spills and releases, and other indicators of environmental burden, such as those frequently published by European firms (as noted above). In addition, energy and resource use efficiency is assessed, along with market and regulatory risk exposure. Beyond these general categories, sector-specific metrics are analyzed based on the relevant risk factors for each sector. Examples include fuel mix in the electric utility sector, exposure to EPA’s Cluster Rule in the pulp and paper sector, and fuel efficiency in the automotive sector. A key element of the analysis is adjusting for risk exposure among companies in the same sector due to such factors as product mix and geographic location. In addition, the model analyzes performance over time as well as static risk indicators. Especially in terms of risk, preference is given to quantitative data, or, when such data are not available, qualitative assessments.
In the opportunity area, the model analyzes capacity to develop environmentally favorable products and services, market positioning to sell them effectively, and actual involvement in marketing them. Capacity indicators include resources devoted to this area, research and development focus, and strategic planning procedures. Market positioning indicators include geographic regions served, demographics of customer base, and vulnerability to substitution. Involvement indicators include assessing the extent to which companies are developing and/or marketing environmentally favorable products and service.
The EcoValue’21™ model is strongly future-oriented. As a result, factors such as management of environmental issues and strategic positioning are weighted more heavily. Beyond risk assessment, quantitative assessments of historic and current environmental performance are used to authenticate stated commitments to improving corporate environmental performance. Or, in other words, to verify that the company is “walking its talk” and to avoid being “greenwashed.”
In terms of management, the model analyzes many planning, environmental management systems (EMSs), and governance metrics. Planning indicators include the extent to which environmental issues are incorporated into the overall business strategy. This includes an assessment of the degree to which the environment is being used to build competitive advantage, rather than being used only for public relations purposes. EMS indicators include the quality of the environmental policy; use of life-cycle analysis to assess impacts; evaluation of eco-efficiency initiatives; EMS quality, including the use of third-party certification schemes such as ISO 14001; performance monitoring and accounting systems; training procedures; supplier screening and engagement programs; quality of public reporting; auditing procedures; and participation in voluntary programs and product labeling schemes. Governance indicators include board involvement, management structure, compensation programs, and more subjective indicators such as company culture and senior management commitment.
Implementing the EcoValue’21™ process involves first assessing the key upside and downside environmental issues in each sector and analyzing sector leaders’ strategies of. This information is used to build a template against which the sector is analyzed. Then information is gathered from such sources as government databases, NGOs, periodical and Web searches, financial community reports, and company information, including annual reports, 10Ks, 10Qs, environmental and sustainability reports, Websites and any other available publications. Following this, company executives (often vice presidents of environment or health and safety) are interviewed to complete the data-gathering process.
Once data are gathered for each of the roughly 60 EcoValue’21™ metrics, weightings are assigned as described above. These weighted scores are added to produce bottom-line numeric scores for each company in a given sector. Then best-in-class letter scores, ranging from AAA to CCC, are assigned to project relative stock market performance. The following box provides the rational for the rating of one company, FPL Group.
| FPL Group FPL Group, the parent of Florida Power & Light, received a AAA EcoValue’21™ rating in the U.S. electric utility sector. The rating reflects FPL’s moderate risk level, excellent risk management, and sector-leading development of environmentally favorable businesses. With a diversified fuel mix, the company has lower risk exposure than those relying more heavily on coal or nuclear. Proactive risk management includes extensive training and performance measurement, linking compensation to environmental performance, and implementing a leading environmental management system. Aggressive efforts to improve eco-efficiency include improving power plant efficiency, extensive recycling, and replacing toxic materials with lower-impact substitutes. FPL is also one of the largest developers of wind power in the United States. |
D. Measurement Results
The EcoValue’21™ model was designed to estimate stock market potential over the mid- to longer term. The model is not intended to forecast short-term stock market potential; nevertheless, it has been successful in doing so. In every high-environmental-impact sector and nearly every other sector, the average total stock market return of companies with above-average EcoValue’21™ ratings exceeded the average return of bottom-half companies by 300 to 3,000 basis points per year. (Established in 1996, Innovest has rated more than 1,200 mostly large-cap companies in North America, Europe, and Asia.) Table 1 shows top-half/bottom-half differentials in a few sectors[8].
Table 1
EcoValue’21™ performance
| Sector | Time Period | Top-Half/Bottom-Half Differential (basis points) |
| Electric utilities (U.S.) | 8/98–7/01 | 4,000 |
| Automobiles (global) | 3/99–3/01 | 2,300 |
| Mining (global) | 2/98–2/01 | 2,200 |
| Food (global) | 9/97–9/00 | 3,500 |
| Steel (global) | 8/97–8/00 | 2,700 |
A study by QED International Associates (Blank and Carty, 2001) further illustrates how environmental ratings can be used to enhance investor returns. In the study, three different tests of EcoValue’21™ were conducted. In the first test, the stock market returns of two equally weighted portfolios were compared, top-rated companies (AAA and AA—27 percent of the rated universe) versus the universe of companies rated by Innovest for the years 1997 to 2000. Over the entire period, the top-rated companies returned 12.4 percent annually, compared with 8.9 percent for the entire universe of rated stocks. The top-rated portfolio also had lower volatility than the total universe. (More detailed results and a fuller explanation of the study are available at www.innovestgroup.com.)
Chart 1 shows that $10,000 invested in the Innovest-ranked universe would have grown to $14,037 over four years, compared with $15,946 for the top-ranked companies.
Chart 1. The growth of a $10,000 investment of
top-rated stocks compared with the total universe
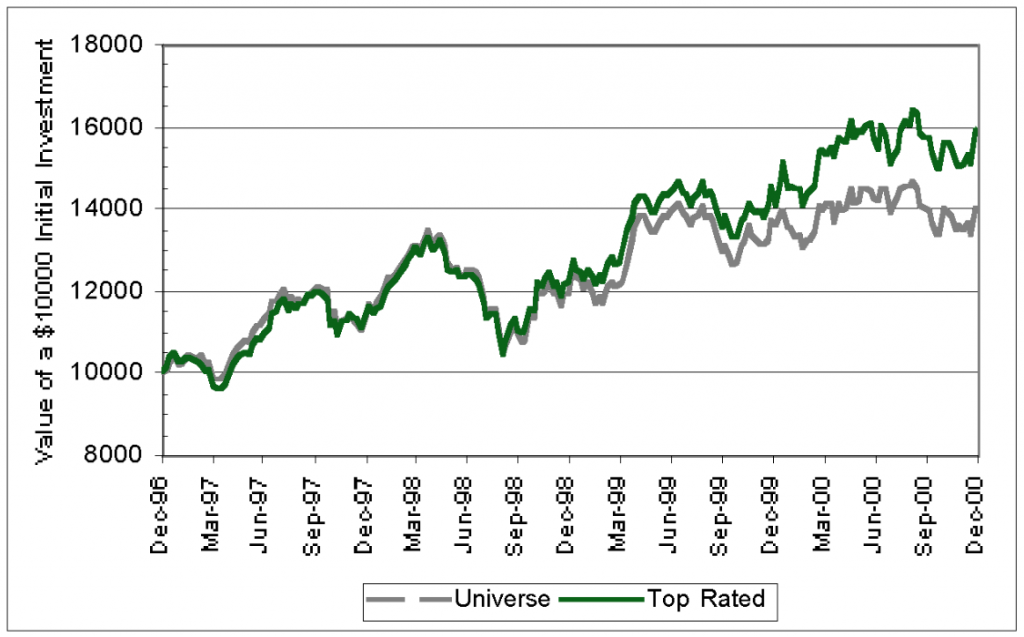
Source: Innovest and QED International Associates, Inc.
To neutralize the effect of varying sector weights, which may have affected results in the first test, a second test was conducted. In this case, a portfolio was constructed that had the same risk profile as the S&P 500, but favored stocks that were rated highly by Innovest, subject to a 50-basis point tracking error. This portfolio was compared to the S&P 500. Chart 2 shows that the Innovest-enhanced portfolio grew from $10,000 to $21,980, compared with $18,782 for the S&P 500 over the years 1997 to 2000. The enhanced portfolio also displayed lower volatility than the S&P 500 over the four-year period. QED estimates that roughly half of the widening performance differential in 2000 is due to the downturn in internet-related stocks.
Chart 2. Growth of $10,000 in the value of portfolios
tilted to top-rated stocks compared with the S&P 500
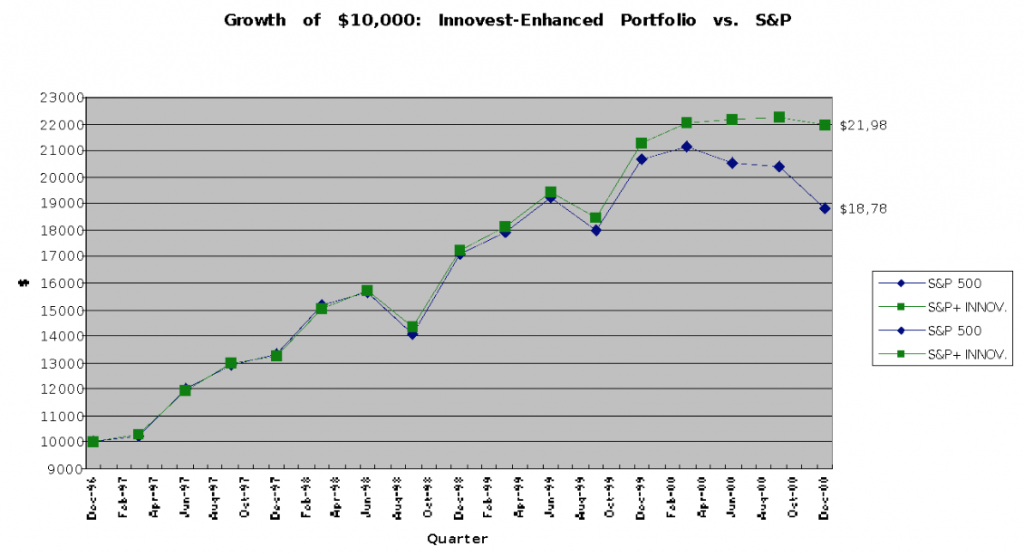
Source: Innovest and QED International Associates, Inc.
The third test of the EcoValue’21™ model compares top-rated companies (AAA and AA) with bottom-rated companies (B and CCC) in the most environmentally sensitive sectors (chemicals, electric utilities, forest products, mining, petroleum, and steel) over the four-year period, 1997 to 2000. Chart 3 shows that the portfolio of top-ranked stocks grew to $17,844 in four years, compared with $14,043 for the bottom-ranked stocks. Over the entire period, the top-rated companies returned 18 percent annually compared to10.2 percent for the bottom-rated companies.
Chart 3. A comparison of the growth of a $10,000 investment in
top- and bottom-rated stocks in environmentally intense industry groups
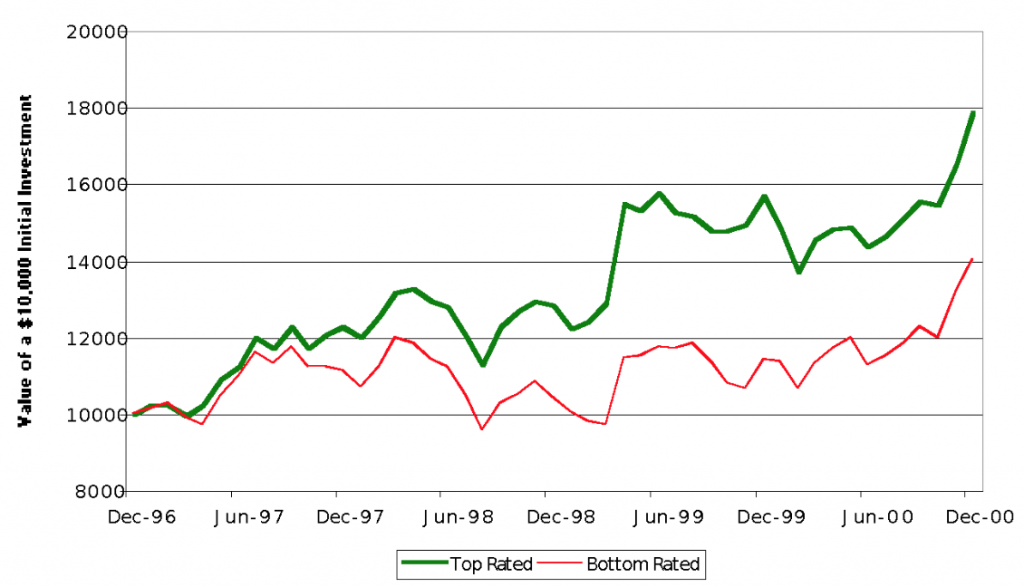
Source: Innovest and QED International Associates, Inc.
The primary reason for the short-term outperformance of environmental leaders found in Innovest’s sector analyses and the QED study is most likely that the EcoValue’21™ ratings are gauging management quality accurately. In effect, the ratings assess management’s ability to deal with complexity, address forces acting on the company, and modify strategies accordingly. As environmental pressures on firms continue to increase, it is likely that stock market performance differentials between environmental leaders and laggards also will grow. As a result, the importance of incorporating corporate environmental performance analysis into investment decisions most likely will increase over time.
E. Application by the Financial Community
Many pension funds, asset managers, and other financial sector organizations use research on corporate environmental performance to help guide equity investments. The large majority of these investments are made through traditional negative screening approaches. However, a growing number of mainstream financial firms use relative environmental performance under a best-in-class, or positive screening, approach. For example, firms including ABN-AMRO, Bank Sarasin, Cambridge Associates, Neuberger Berman, Rockefeller & Co., Schroders, Société Generale, T. Rowe Price, and Zurich Scudder purchase environmental and social research and advisory services from Innovest. Overall, Innovest’s research is used to positively screen and manage approximately $2.5 billion of invested assets.
Positive screening (that is, investing in companies with superior environmental performance) can be used for stock picking and indexing investment approaches. To illustrate, Dutch pension fund ABP (the world’s largest pension fund with $175 billion in assets) is using positive screening to establish two $100 million portfolios, one focused on North American equities and the other on European equities. Innovest’s environmental and social research will be combined with traditional financial analysis to guide investments toward environmental and social leaders. ABP’s goals include reducing risk exposure, enhancing returns, and improving the environmental performance of its investments.
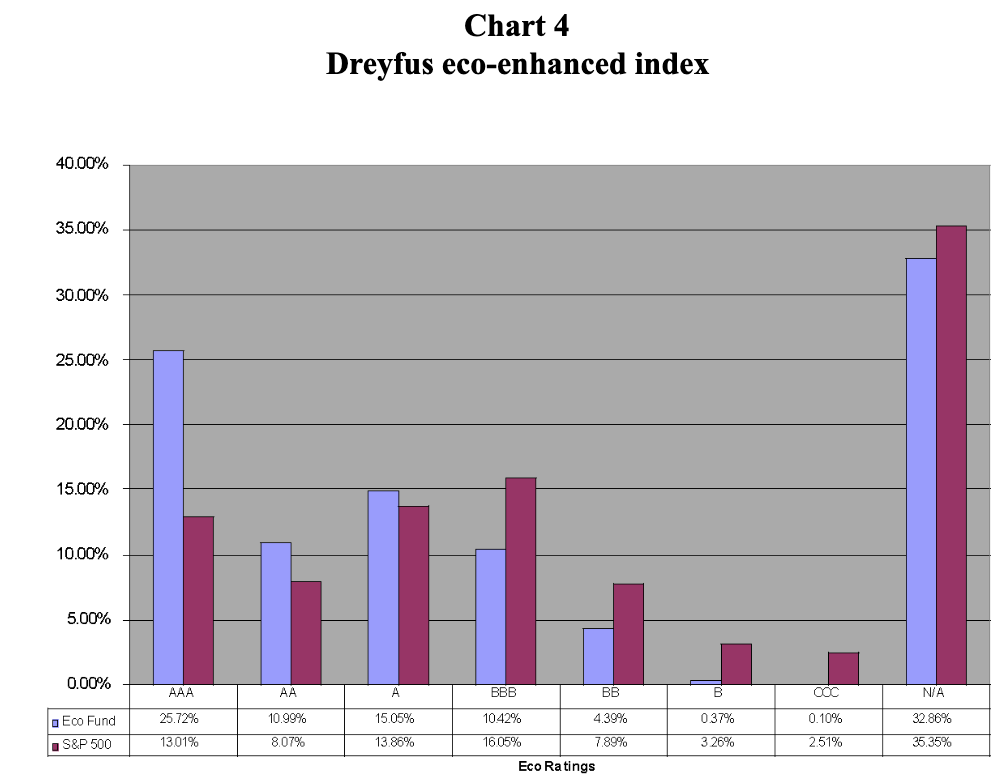
To illustrate indexing approaches, Dreyfus and Mellon Capital Management launched an eco-enhanced index fund strategy in early 2000. The fund maintains the same sector weightings as its benchmark, the S&P 500, but within sectors, Innovest research is used to overweight environmental leaders and underweight lower-rated companies. By shifting investments toward presumably better-managed companies, the fund is intended to outperform the S&P 500, which it has done. Chart 4 illustrates the structure of the Dreyfus-Mellon fund relative to its benchmark.
III. Future Directions
The main barrier to providing investors with corporate environmental performance information has been the lack of high-quality data. As noted above, data quality is improving in industrialized nations; however, it remains poor in developing countries. The next barrier on the performance information front is likely to be finding the key drivers of environmental performance that differentiate companies. As more firms recognize the financial and strategic value of improving environmental performance, leading-edge environmental management systems and strategies are implemented more frequently. In some sectors, such as European pharmaceuticals, this has already occurred, raising standards broadly and making it difficult to differentiate firms on a corporate environmental performance basis. More refined data, increased disclosure of quantitative impacts, and new analytic tools, however, may continue to permit some differentiation among firms.
To date, corporate environmental performance analysis has usually focused on assessing incremental performance improvements and systems to foster them. As companies adopt leading-edge practices, differentiation on this basis will become more difficult. Given the growing importance of the broader concept of environmental sustainability, an alternative approach is to focus analysis on adoption of visionary strategies, pursuit of large-scale change, and movement toward sustainability. To analyze relative sustainability performance effectively, researchers must understand both the concept of sustainability and the actions required to achieve it.
Sustainability is likely to be the greatest challenge ever faced by business because it implies that management must address an extraordinarily complex set of interconnected issues and concepts. As environmental and other forces compel companies to bear more complete responsibility for their negative environmental and social impacts, sustainability likely will become a central focus of management and a key driver of business success. This, in turn, is likely to cause investment advisors to incorporate the issue more fully into their investment decisions. As evidence continues to mount that environmental performance is financially relevant, not screening for it could become a violation of fiduciary responsibility.
The role of corporations in addressing the challenge to become sustainable is likely to expand significantly for several reasons. Through globalization, privatization, and increasing influence over political processes, corporations are taking on a larger role in society, which implies that they will be called on to play a more central role in sustainability. As pollution and other impacts increase and environmental systems approach limits, and as measurement technology continues to improve, negative corporate impacts will become more obvious, and pressures to mitigate those impacts will increase. And as the necessity to address sustainability from a systems perspective becomes more apparent (meaning recognizing that no part of Earth’s system operates in isolation), calls for companies to address their environmental and social impacts more fully will increase.
Providing investors with high-quality information on relative corporate sustainability performance is difficult, in part, because there is no agreed-upon definition of environmental sustainability or the means to achieve it. One method of estimating performance is to develop a theoretical set of actions needed to achieve sustainability, then assess corporate engagement and effectiveness in taking these actions. This requires estimating the responsibility of the corporate sector in achieving sustainability. From a systems perspective, companies affect all aspects of society. As a result, they may be called on increasingly to participate in societal arenas that have not been their traditional focus.
It is unclear whether the bombing of the World Trade Center on September 11, 2001, will affect views on corporate responsibility or the role of corporations in achieving sustainability. However, concerns about security may prompt some companies to more fully assess and mitigate their environmental and social impacts. From an investor’s perspective, growing pressures on companies from many different sources may cause sustainability analysis to become as important as more traditional areas of financial and strategic analysis.
IV. CONCLUSION
The majority of existing research shows that environmental leaders tend to outperform in the stock market. This likely will be true to an even greater degree in the future as companies continue to face growing pressure to improve their environmental and social performance.
Businesses increasingly recognize the importance of environmental performance measurement. Companies around the world currently spend billions of dollars a year on reducing environmental impacts and moving toward sustainability—with growing investments in environmental metrics, accounting, and management systems. Attitudes toward environmental sustainability are diverse, ranging from reactive to proactive. For the most part, proactive companies are those that are best able to address complex, uncertain, and intangible forces affecting their firms effectively. They also are usually leaders in more traditional business areas. As a result, they tend to outperform their competitors in the stock market.
Analysis of corporate environmental
performance is used widely in socially responsible investing, but not nearly as
broadly by the mainstream investment community.
This is changing as a growing number of mainstream firms, such as
ABN-AMRO, Dreyfus, Mellon, and Schroders, use environmental performance as an
additional factor in assessing stock market potential. As the financial impacts of environmental
issues continue to increase, higher-quality data on corporate environmental
performance will be needed to minimize investor risk exposure and maximize
returns.
References
3M, “3M Pollution Prevention Pays: Moving Toward Environmental Sustainability,” 1998.
Baker & McKenzie (Virginia L. Gibson, Bonnie K. Levitt, and Karine H. Cargo), “Overview of Social Investments and Fiduciary Responsibility of County Employee Retirement System Board Members in California,” Chicago, 2000.
Bank Sarasin, “Sustainable Investments: An Analysis of Returns in Relation to Environmental and Social Criteria,” 1999.
Center for the Study of Financial Innovation, “Measuring Environmental Risk,” 1994.
Clough, Richard, “Impact of an Environmental Screen on Portfolio Performance: A Comparative Analysis of S&P Stock Returns,” Durham, N.C.: Duke University, 1997.
Cogan, Douglas, “Tobacco Divestment and Fiduciary Responsibility, A Legal and Financial Analysis,” Investor Responsibility Research Center, January 2000.
Cohen, M. A., S. A. Fenn, and J. S. Naimon, “Environmental and Financial Performance Are they related?” Nashville, Tenn.: Vanderbilt University, Owen Graduate School of Management, 1995.
Cram, Don, and Koehler, Dinah, “The Financial Impact of Corporate Environmental Performance: Evidence of the Link between Environmental and Financial Performance,” working draft, May 2001.
Dowell, G., S. Hart, and B. Yeung, “Do Corporate Global Environmental Standards Create or Destroy Market Value?” Management Science 46, 2000.
European Federation of Financial Analysts, “Eco-Efficiency and Financial Analysis: The Financial Analysts View,” 1996.
Feldman, S. J., P. A. Soyka, and P. Ameer, “Does Improving a Firm’s Environmental Management System and Environmental Performance Result in a Higher Stock Price?” Journal of Investing 6, 1997.
Hart, Stuart L., and Gautam Ahuja, “An Empirical Examination of the Relationship Between Pollution Prevention and Firm Performance,” Ann Arbor: University of Michigan, School of Business Administration, September 1994.
ICF Kaiser, “Does Improving a Firm’s Environmental Management System and Environmental Performance Result in a Higher Stock Price?” 1996.
Johnson, M. F., M. Magnan, and C. H. Stinson, “Nonfinancial Measures of Environmental Performance as Proxies for Environmental Risks and Uncertainties,” 1998.
Konar, S., and M .A. Cohen, “Does the Market Value Environmental Performance?” Review of Economics and Statistics 83, May 2001.
Koppes, Richard H., and Maureen L.Reilly, “An Ounce of Prevention: Meeting the fiduciary Duty to Monitor an Index Fund through Relationship Investing,” The Journal of Corporation Law, University of Iowa, Spring 1995.
McKeown, William B., “On Being True to Your Mission: Social Investments for Foundations,” Journal of Investing, Winter 1997.
Pava, and Krausz, “Corporate Responsibility and Financial Performance,” 1995.
QED International Associates, Inc. (Herb D. Blank and C. Michael Carty), “The Eco-Efficiency Anomaly,” April 30, 2001.
Repetto, Robert, and Duncan Austin, “Coming Clean: Corporate Disclosure of Financially Significant Environmental Risks,” World Resources Institute, 2000.
Russo, M. V., and P. A. Fouts, “A Resource-Based Perspective on Corporate Environmental Performance and Profitability,” Academy of Management Journal 40, 1997.
Snyder, Jonathan, C.F.A., et al., “The Performance Impact of an Environmental Screen,” Winslow Management Company/Eaton Vance, 1993.
Social Investment Forum, “1999 Report on Socially Responsible Investing Trends in the United States,” Author, 1999.
Social Investment Forum, “7 Out of 8 Largest Social Funds Get Top Performance Marks for 2000,” Author, January 2001.
Solomon, Lewis D. and Karen Coe, The Legal Aspects of Social Investing by Non-Profits, Journal of Investing, Winter 1997.
U.S. Environmental Protection Agency, “Environmentally Screened Index Investing,” November 1996.
U.S. EPA, “Green Dividends? The Relationship Between Firms’ Environmental Performance and Financial Performance,” 2000.
White, Mark A., “Corporate Environmental Performance and Shareholder Value,” Charlottesville: University of Virginia, McIntire School of Commerce, November 1995.
World
Business Council for Sustainable Development, “Environmental Performance and
Shareholder Value,” 1997.
[1] The author wishes to thank Carla Tabossi for providing significant assistance in researching and writing this chapter. Sincere thanks are also given to Daniel Esty and Peter Cornelius for providing invaluable editorial feedback.
[2] While there are many views on the meaning of environmental sustainability, the concept generally refers to not reducing the ability of the environment to meet the needs of future generations. The broader term, sustainability, addresses environmental and social issues, such as meeting basic human needs and respecting cultural diversity. The two terms are related, not only because they both refer to environmental issues, but also because environmental sustainability probably cannot be achieved without addressing social issues. For example, if basic human needs are not met, people might clear forests (needed for environmental sustainability) to survive in the short term.
[3] Following are some of the studies in which positive correlations between environmental and financial performance were found: Konar and Cohen, 2001; Dowell, Hart, and Young, 2000; Johnson, Magnan, and Stinson, 1998; Russo and Fouts, 1997; Feldman, Soyka, and Ameer, 1997; Clough, 1997; European Federation of Financial Analysts, 1996; Cohen, Fenn, and Naimon, 1995; White, 1995; Hart and Ahuja, 1994: and Snyder, 1993.
[4] Greenwashing generally refers to efforts by companies to portray themselves as being environmentally responsible, for the purpose of improving stakeholder relations, without significantly improving actual performance. An example of greenwashing might be when an electric utility focuses its corporate environmental report on building wildlife sanctuaries near it headquarters, but hardly addresses its power plants emissions. The sanctuaries are important, but probably not financially relevant to the firm, as emissions most likely would be.
[5] Negative screening involves avoiding investments in certain industry sectors with high environmental risks, such as nuclear power, as well as avoiding investments in sectors such as alcohol and tobacco that investors oppose for ethical reasons. This approach can reduce diversity and increase portfolio risk.
[6] For example, a letter from the U.S. Department of Labor to William M. Tartikoff, Senior Vice President and General Counsel of Calvert Group Ltd., dated May 28, 1998, stated that the Department of Labor “has expressed the view that the fiduciary standards of [ERISA] sections 403 and 404 do not preclude consideration of collateral benefits, such as those offered by a ‘socially-responsible” fund, in a fiduciary’s evaluation of a particular investment opportunity,” provided that the investment is equal to or superior to alternative available investments on an economic basis.
[7] Information from these databases can be downloaded from the nonprofit Right-To-Know network (www.RTK.net), which has been given authority by the U.S. government to disseminate these data to the general public.
[8] More information about EcoValue’21™ and Innovest in general is available at www.innovestgroup.com.